A 300 flat portfolio, run out of spreadsheets
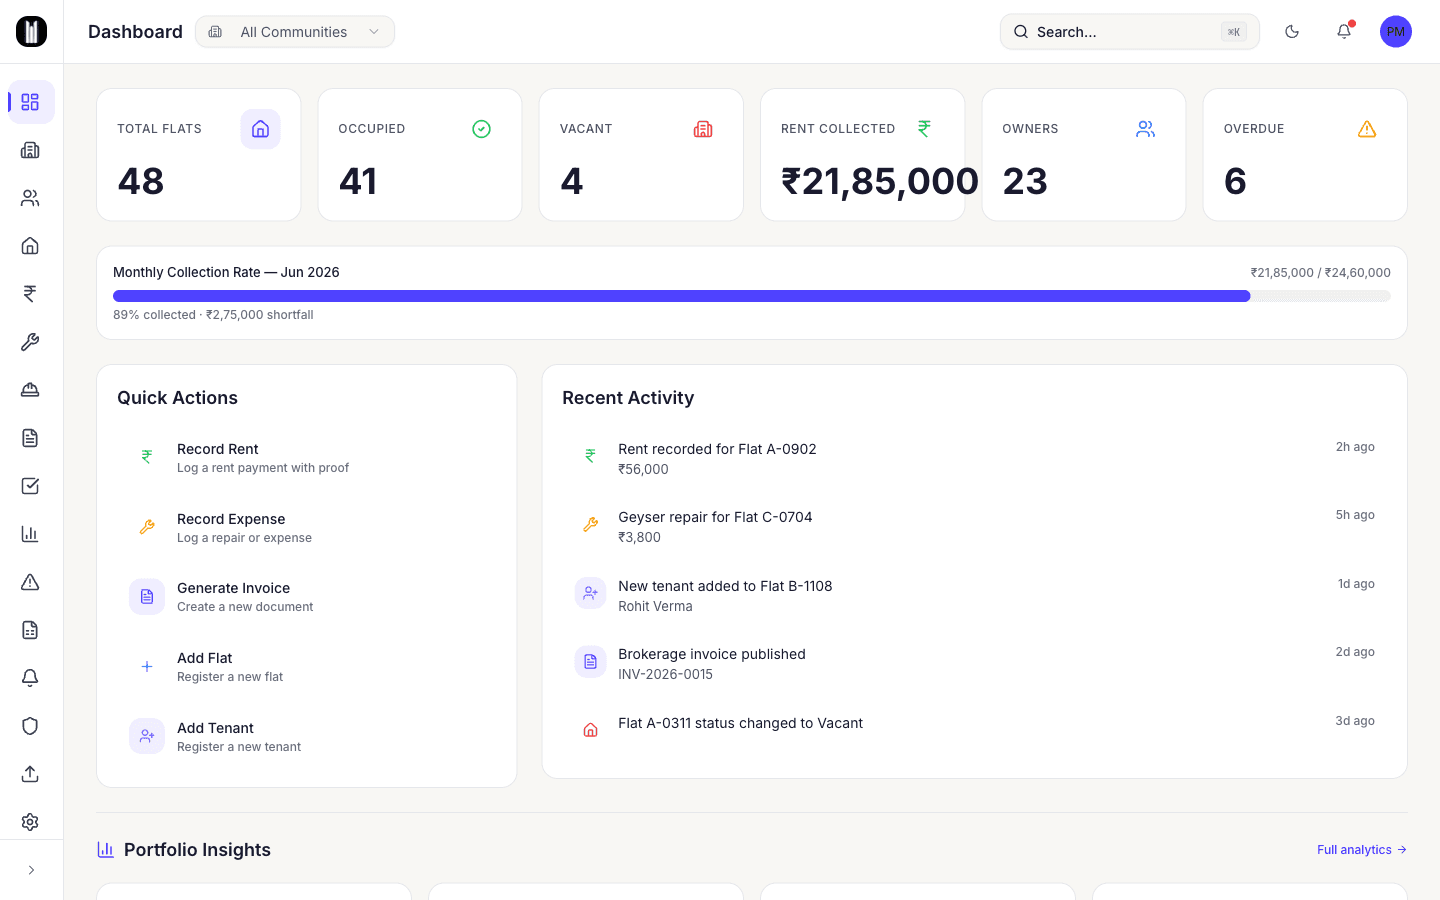
A real estate firm was running an entire rental portfolio of 300+ flats out of spreadsheets. Rent, leases, tenants, owner payouts, repairs, all in separate sheets that one or two people fully understood.
Lease renewals slipped. Rent went uncollected because nobody had a single view of who had paid. And repairs were always reactive. A call came in only after something had already broken.
So I sat with the people doing the work, scoped what actually slowed them down, and built the whole product end to end on Next.js, TypeScript and Supabase.
The portfolio explains itself
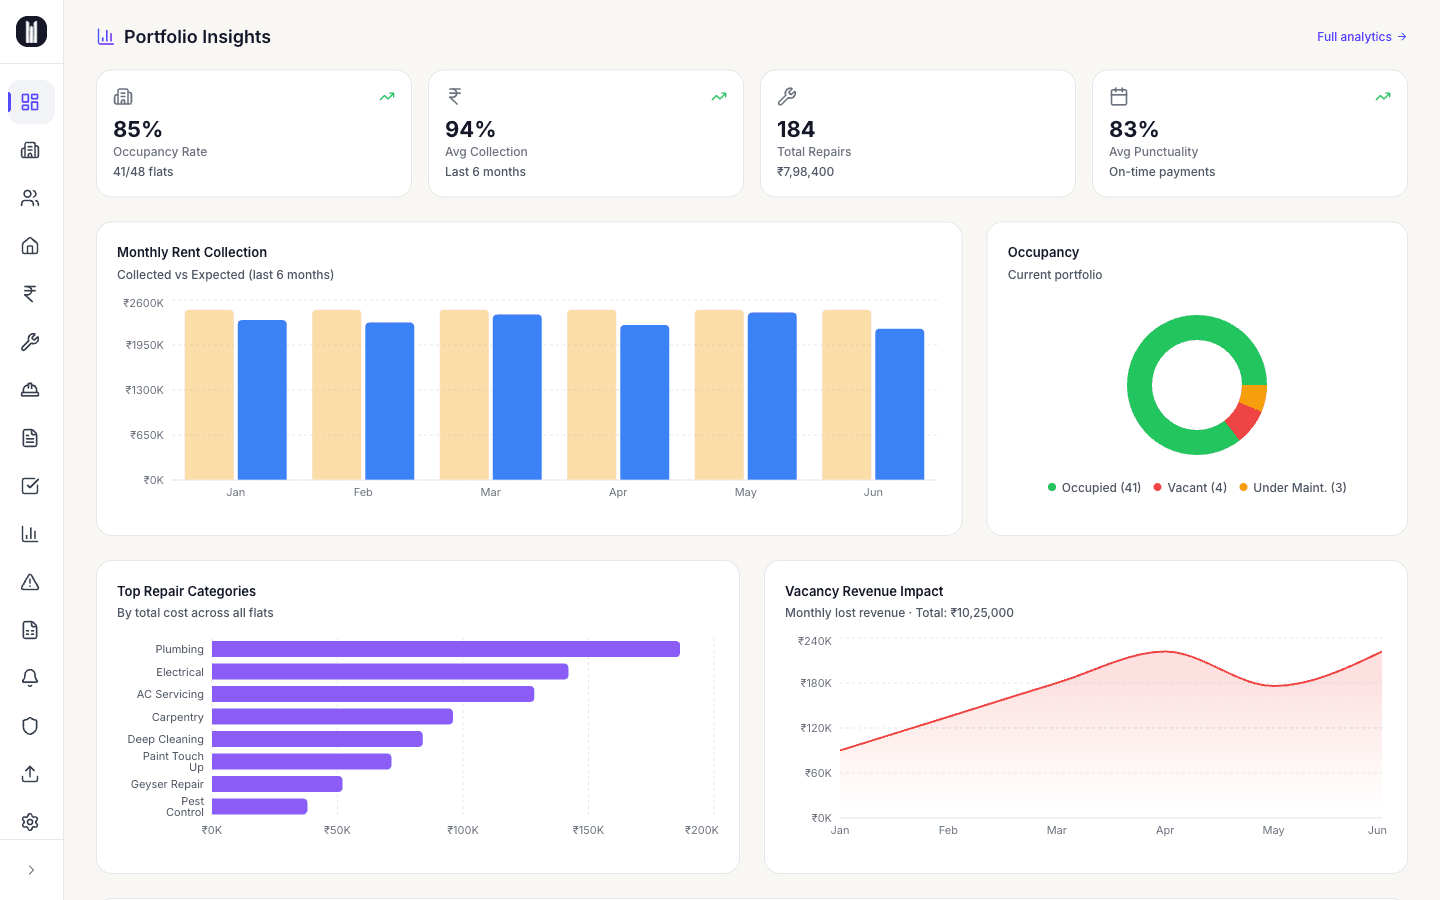
Below the headline numbers, the data tells its own story. Collection trends, the occupancy mix, and the repair categories quietly eating the budget.
Every empty flat shows the revenue it is losing while it sits vacant. The information was always there. This is the first time anyone could actually read it.
Analytics anyone can read
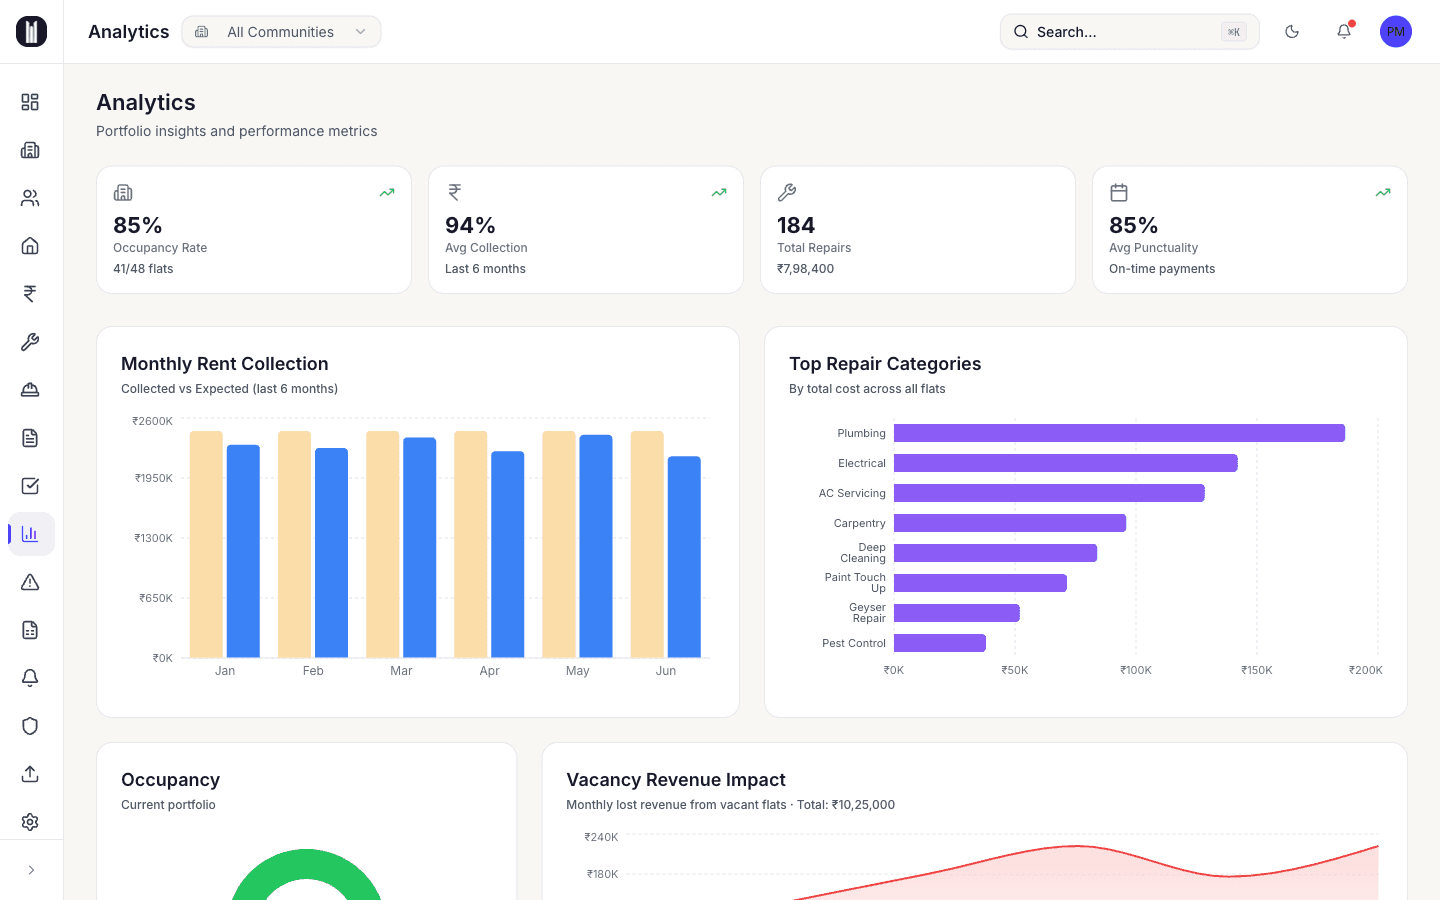
A dedicated analytics view turns months of operations into trends, not tables. Punctuality per flat, collection over time, and where maintenance spend really lands.
It is built for the owner who wants the health of the portfolio at a glance, without asking anyone to pull a report.
Then it starts predicting
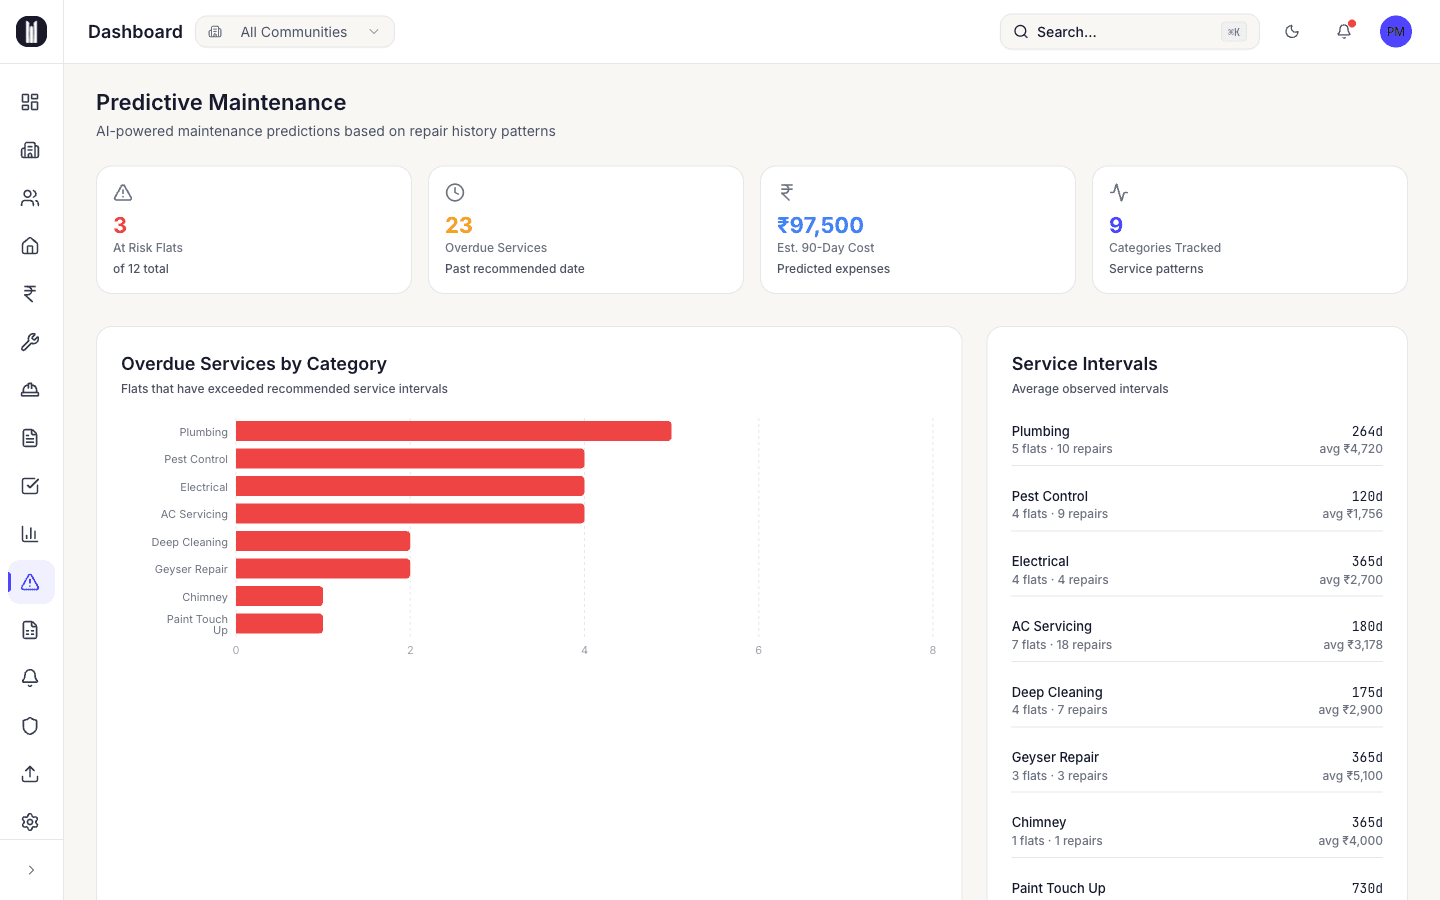
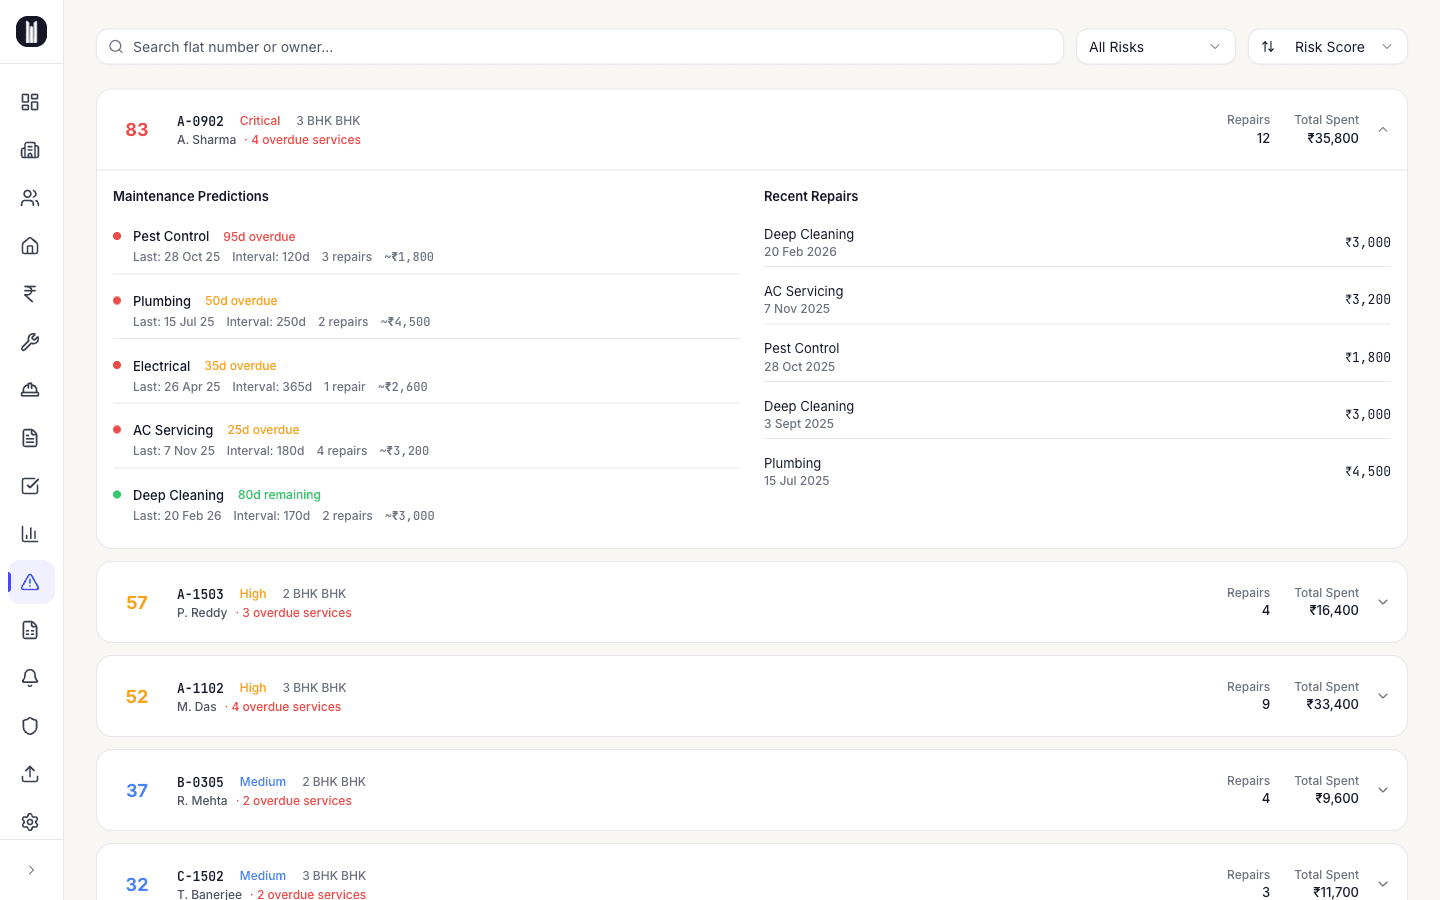
This is the bet the whole product is built toward. It stops describing the past. The engine turns the firm's own repair history into a forecast: one risk score from 0 to 100 for every flat.
Each category has a rhythm. AC roughly every six months, plumbing closer to nine, a geyser about a year. Once a flat has its own history, the engine learns that flat's real interval and stops trusting the average.
At a glance: how many flats are at risk, what is overdue, and the cost likely to land in the next ninety days.
Down to the single flat
Open any flat and it lays out the per category forecast. What is overdue and by how many days, what it is likely to cost, and the history behind the call.
Reactive maintenance becomes a planned schedule. The team fixes the riskiest units first, before a tenant ever has to call.
Reactive became proactive
The spreadsheets are gone. The team runs the whole portfolio from one dashboard, and the work that used to eat their week is roughly 50% faster.
The predictive layer changed the business itself. Instead of waiting for a breakdown, the team sees which flats are at risk and what the next ninety days will cost. Reactive became proactive.
It shipped to production and runs as the firm's internal operations tool. Because it holds private tenant and owner data, the screens here use representative demo data, not real records.